C2 Detection - Command & Carol
C2 Detection - Command & Carol
Room Link: https://tryhackme.com/room/detecting-c2-with-rita-aoc2025-m9n2b5v8c1
🧠 Knowledge Inbox (Unfamiliar Things)
Quickly list things you don't know here. Define them LATER.
📝 Lab Journal
Chronological log of actions, commands, and findings.
Task 1: Introduction
The TBFC is very wary since the last series of attacks by the underlings of King Malhare. They are on full alert for anything happening. But they are getting restless; it is too quiet. Sir Elfo of the TBFC takes the initiative and proposes to hunt for Command and Control (C2) traffic using the meticulously collected network traffic. A majority of the TBFC elves object, we don't have the time to go through so much network traffic! Sir Elfo chuckles, don't fret, for I have a powerful tool to assist us! I present to you RITA, Real Intelligence Threat Analytics. We just need to convert our PCAP file to Zeek logs, and RITA will do the rest! Anyone can do it, just follow today's tasks.
Learning Objectives
- Convert a PCAP to Zeek logs
- Use RITA to analyze Zeek logs
- Analyze the output of RITA
Task 2: Reconnaissance
The Magic of RITA
Real Intelligence Threat Analytics (RITA) is an open-source framework created by Active Countermeasures. Its core functionality is to detect Command and Control (C2) communication by analyzing network traffic captures and logs. Its primary features are:
- C2 beacon detection
- DNS Tunneling detection
- Long connection detection
- Data Exfiltration detection
- Checking threat intel feeds
- Score connections by severity
- Show the number of hosts communicating with a specific external IP
- Shows the datetime when the external host was first seen on the network
The magic behind RITA is its analytics. It correlates several captured fields, including IP addresses, ports, timestamps, and connection durations, among others. Based on the normalized and correlated dataset, RITA runs several analysis modules collecting information like:
- Periodic connection intervals
- Excessive number of DNS queries
- Long FQDN
- Random subdomains
- Volume of data over time over HTTPS, DNS, or non-standard ports
- Self-signed or short-lived certificates
- Known malicious IPs by cross-referencing with public threat intel feeds or blocklists
RITA only accepts network traffic input as Zeek logs. Zeek is an open-source network security monitoring (NSM) tool. Zeek is not a firewall or IPS/IDS; it does not use signatures or specific rules to take an action. It simply observes network traffic via configured SPAN ports (used to copy traffic from one port to another for monitoring), physical network taps, or imported packet captures in the PCAP format. Zeek then analyzes and converts this input into a structured, enriched output. This output can be used in incident detection and response, as well as threat hunting. Out of the box, Zeek covers two of the four types of NSM data: transaction data (summarized records of application-layer transactions) and extracted content data (files or artifacts extracted, such as executables).
PCAP, I Convert Ye to Zeek logs
Let's get started! A neat feature of Zeek is that it can convert packet captures (PCAPs) into structured logs. If you haven't yet done so, open the VM and start a terminal. Navigate to the home directory of the logged-in user and list its contents. As shown in the terminal below, we can see two directories named pcaps and zeek_logs.
RITA walkthrough
ubuntu@tryhackme$ ls
Desktop  Documents  Downloads  Music  Pictures  Public  Templates  Videos  pcaps  zeek_logs
The pcaps directory contains example PCAPs of real-life incidents collected from Bradly Duncan's blog. He has a wonderful collection of malware-related PCAPs that cover real-world threats.
The zeek_logs directory contains Zeek logs. These were created by parsing a PCAP file. Let's parse a PCAP ourselves and look at the output Zeek logs. We will use the zeek readpcap <pcapfile> <outputdirectory> command.
RITA walkthrough
ubuntu@tryhackme$ zeek readpcap pcaps/AsyncRAT.pcap zeek_logs/asyncrat
Starting the Zeek docker container
Zeek logs will be saved to /home/ubuntu/zeek_logs/asyncrat
Let's examine the logs created. Navigate to /home/ubuntu/zeek_logs/asyncrat and list its contents. The output should be similar to the one shown on the terminal below.
RITA walkthrough
ubuntu@tryhackme$ cd /home/ubuntu/zeek_logs/asyncrat/ && ls
capture_loss.log  dns.log    http.log         known_services.log  notice.log  packet_filter.log  software.log  stats.log  x509.log
conn.log          files.log  known_hosts.log  loaded_scripts.log  ocsp.log    reporter.log       ssl.log       weird.log
In the terminal above, we can see the different Zeek logs that were generated. For using RITA, we don't really need to know what is in these logs (although the names are quite self-descriptive); however, if you are interested, you can use cat to examine their contents. You can find more info at https://docs.zeek.org/en/master/logs/index.html if you want a detailed description.
Now, Analyze This RITA
Now that we have prepared the Zeek logs, we can import them into RITA and unleash its analytics.
Enter the command below to import the Zeek logs and let RITA do its work. Once you enter the command, RITA will parse and analyze the imported logs. As seen in the terminal, a lot of output is produced. The terminal output was redacted in the example below to keep it tidy.
RITA walkthrough
ubuntu@tryhackme$ rita import --logs ~/zeek_logs/asyncrat/ --database asyncrat
[REDACTED]
2025-10-23T10:56:58Z INF Initiating new import... dataset=asyncrat directory=/tmp/zeek_logs rebuild=false rolling=false started_at="2025-10-23 10:56:58.079568235 +0000 UTC m=+0.013974881"
2025-10-23T10:56:58Z INF [THREAT INTEL] Updating online feed... feed_url=https://feodotracker.abuse.ch/downloads/ipblocklist.txt
[-] Parsing:  /tmp/zeek_logs/conn.log
[-] Parsing:  /tmp/zeek_logs/http.log
[-] Parsing:  /tmp/zeek_logs/ssl.log
[-] Parsing:  /tmp/zeek_logs/dns.log
Log Parsing ? ??????????????????????????????????????????????????????????? 4 / 4
[REDACTED]
Now that RITA has parsed and analyzed our data, we can view the results by entering the command rita view <database-name>. Now enter the command below. Note: It is important to consider the dataset's size. Larger datasets will provide more insights than smaller ones. Smaller datasets are also more prone to false positive entries. The one we are using is rather small, but it contains sufficient data for an initial usable result.
RITA walkthrough
ubuntu@tryhackme$ rita view asyncrat
After entering the command, we can see a structured terminal window with the results, as shown in the image below.

The terminal window shows three elements: the search bar, the results pane, and a details pane.
Search bar
To search, we need to enter a forward slash (/). We can then enter our search term and narrow down the results. The search utility supports the use of search fields. When we enter ? while in search mode, we can see an overview of the search fields, alongside some examples. The image below shows the help for the search utility. To exit the help page, enter ? again. Enter the escape key ("esc") to exit the search functionality.

Results pane
The results pane includes information for each entry that can quickly help us recognize potential threats. The following columns are included:
- Severity: A score calculated based on the results of threat modifiers (discussed below)
- Source and destination IP/FQDN
- Beacon likelihood
- Duration of the connection: Long connections can be indicators of compromise. Most application layer protocols are stateless and close the connection quickly after exchanging data (exceptions are SSH, RDP, and VNC).
- Subdomains: Connections to subdomains with the same domain name. If there are many subdomains, it could indicate the use of a C2 beacon or other techniques for data exfiltration.
- Threat intel: lists any matches on threat intel feeds
We can see two interesting findings: an FQDN pointing to sunshine-bizrate-inc-software[.]trycloudflare[.]com and an IP 91[.]134[.]150[.]150. Move the keyboard arrows to select the first entry. You should then see detailed information in the right pane.
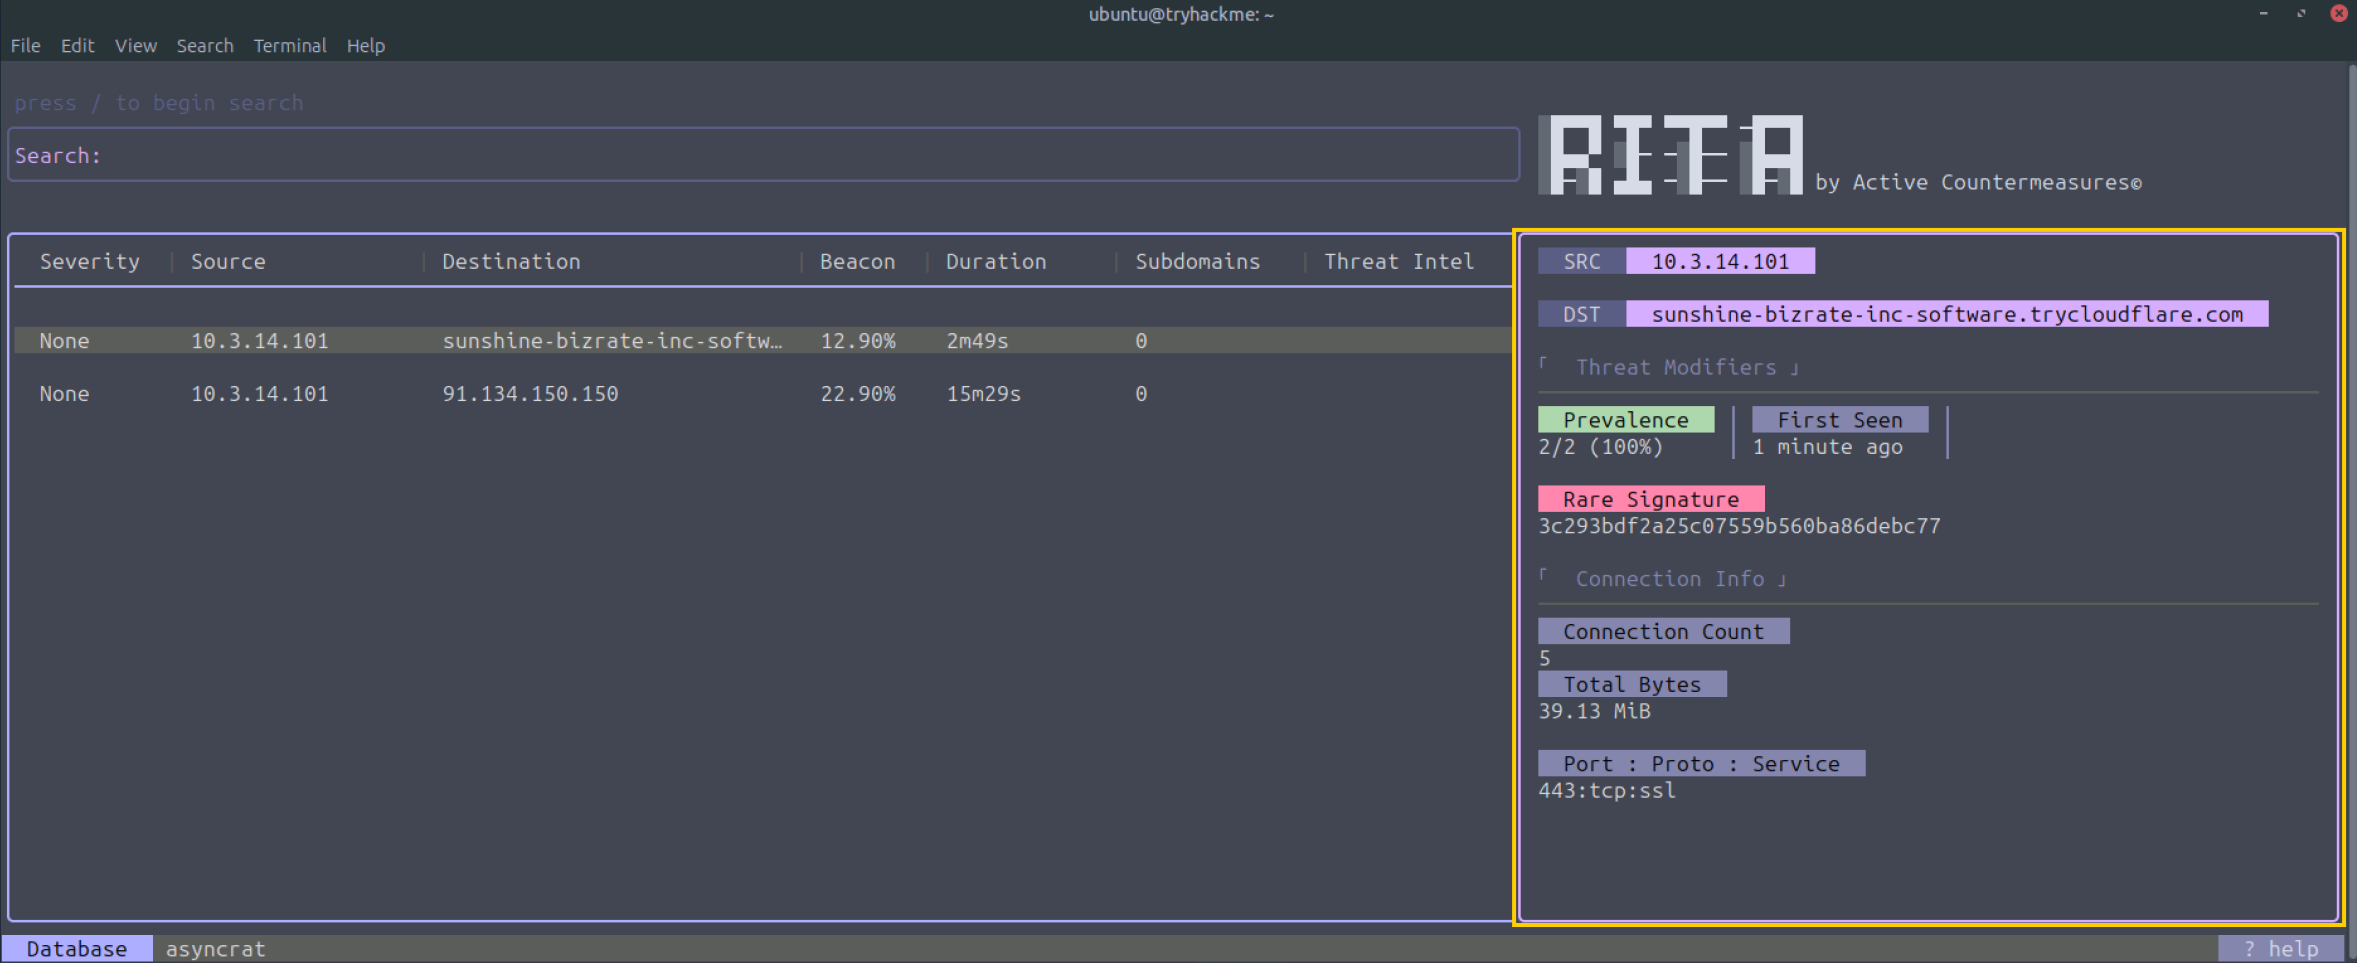
Details pane
Apart from the Source and Destination, we have two information categories: Threat Modifiers and Connection info. Let's have a closer look at these categories:
Threat Modifiers
These are criteria to determine the severity and likelihood of a potential threat. The following modifiers are available:
- MIME type/URI mismatch: Flags connections where the MIME type reported in the HTTP header doesn't match the URI. This can indicate an attacker is trying to trick the browser or a security tool.
- Rare signature: Points to unusual patterns that attackers might overlook, such as a unique user agent string that is not seen in any other connections on the network.
- Prevalence: Analyzes the number of internal hosts communicating with a specific external host. A low percentage of internal hosts communicating with an external one can be suspicious.
- First Seen: Checks the date an external host was first observed on the network. A new host on the network is more likely to be a potential threat.
- Missing host header: Identifies HTTP connections that are missing the host header, which is often an oversight by attackers or a sign of a misconfigured system.
- Large amount of outgoing data: Flags connections that send a very large amount of data out from the network.
- No direct connections: Flags connections that don't have any direct connections, which can be a sign of a more complex or hidden command and control communication.
Connection Info
Here, we can find the connections' metadata and basic connection info like:
- Connection count: Shows the number of connections initiated between the source and destination. A very high number can be an indicator of C2 beacon activity.
- Total bytes sent: Displays the total amount of bytes sent from source to destination. If this is a very high number, it could be an indication of data exfiltration.
- Port number - Protocol - Service: If the port number is non-standard, it warrants further investigation. The lack of SSL in the Service info could also be an indicator that warrants further investigation.
What Is This?
Now that we have covered the look and feel of RITA, let's focus on the results displayed by RITA. Most of the time, the results that are displayed warrant some attention. Even if the entry does not have a high severity score, it can still be an indicator of compromise. We are using a smaller dataset, and this has some downsides. For example, the First Seen threat modifier is relatively low due to small-timeframe packets being captured. This can affect the Severity score.
In any case, we can still examine the entries and their details and make our own analysis. Let's examine the first entry.

The first thing we notice is the long FQDN sunshine-bizrate-inc-software[.]trycloudflare[.]com. A quick search on VirusTotal indicates that this URL is flagged as malicious. Wow, that was easy! Go ahead and check the destination IP of the second entry as well. We are lucky to have found known Indicators of Compromise immediately. However, this is not always the case; attackers often change their infrastructure and rotate IPs and domain names. Therefore, we should look a bit further when we don't have a hit with known IoCs. Let's analyze the entries a bit more.
When we look at the details pane, we can see some more info. RITA included the rare signature threat modifier. This inclusion indicates that the combination of certain parameters (for example, SSL certificate details) related to this connection is uncommon compared to the rest of the analyzed HTTPS traffic. Malware or C2 connections often create unique TLS handshake patterns that differ from those of browsers and legitimate clients, making them stand out even though the payload is encrypted.
There is not much more we can say about the first entry, so let's have a look at the second entry:
- The IP is malicious according to VirusTotal
- The connection duration is quite long
- The ports mentioned are non-standard ports
This information warrants further investigation. You can pivot on the information you have obtained and dig into the Zeek logs and PCAP file. This is out of scope for this walkthrough, but feel free to dig into it and find out information. Just be cautious, as some of the PCAPs may contain malicious files, domains, and IPs that are still in use.
Each Will Do His Part
Now that everyone has gone through the manual, let's hunt those "malrabbits" down! We have put a lot of effort into capturing network traffic. Please analyze the ~/pcaps/rita_challenge.pcap with RITA and answer the questions below. Note: Use the learned steps to process the PCAP and analyze it with RITA.
| Task | Question | Flag |
|---|---|---|
| 1 | How many hosts are communicating with malhare.net? | 6 |
| 2 | Which Threat Modifier tells us the number of hosts communicating to a certain destination? | prevalence |
| 2 | What is the highest number of connections to rabbithole.malhare.net? | 40 |
| 2 | Which search filter would you use to search for all entries that communicate to rabbithole.malhare.net with a beacon score greater than 70% and sorted by connection duration (descending)? | dst:rabbithole.malhare.net beacon:>=70 sort:duration-desc |
| 2 | Which port did the host 10.0.0.13 use to connect to rabbithole.malhare.net? | 80 |
🎓 Key Takeaways
- Learned how to use RITA for detecting Command and Control (C2) traffic patterns in network captures
- Understood how Zeek converts PCAPs into structured logs for analysis
- Practiced identifying C2 indicators: beaconing patterns, long connections, high subdomain counts
- Used threat modifiers (prevalence, rare signature, first seen) to assess severity
- Cross-referenced findings with VirusTotal for IOC validation
- Key detection techniques: DNS Tunneling, Data Exfiltration patterns